I Didn't Need a Chart — I Could Just See It
A while ago, a customer sent us a photo of her schedule and watched Zooza Assistant turn it into a full term of live classes. We filmed it. We thought that was the story.
Then another customer — the admin of a franchise running children's activities across a whole city — showed us what she'd been doing. Not creating classes. Reading her own operation back to herself. She'd taken her data, connected it to an AI, and built her own custom reports — the exact views she makes decisions on. Not the reports someone decided she should have. The ones she actually runs on.
And the line that stuck with us, when we asked why she hadn't just made a graph:
That's the shift. Not another dashboard to log into. Not a reporting module with forty filters. Just your questions, answered as a picture you can read at a glance — shaped the way you think.
Four Questions She Asked — and What Came Back
Every one of these is a real operational question a growing activity business has to answer, usually by scrolling through spreadsheets or holding it all in your head. She just asked for each one in plain words.
1. “Who's covering which venue this week?”
When someone calls in sick, the first question is always the same: who's free, and where is everyone already? She asked for one grid — every instructor down the side, every day across the top, the venue in each cell.
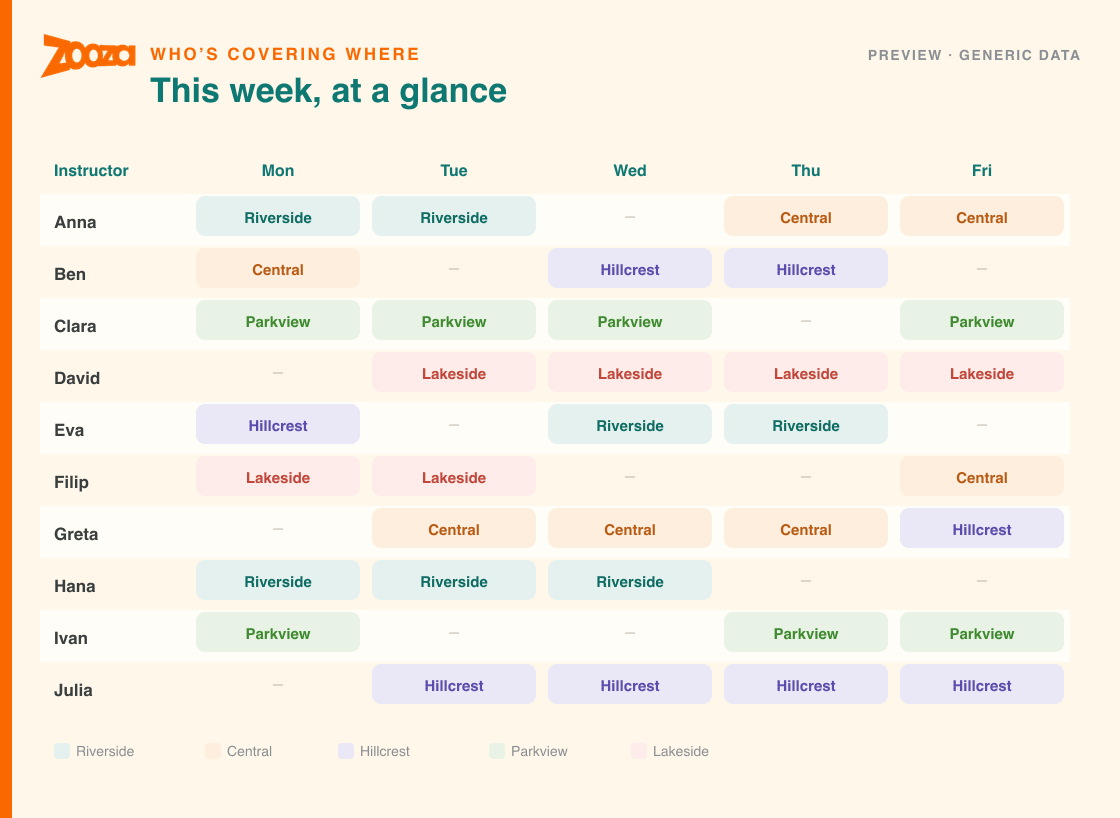
No cross-referencing five tabs. The whole week's coverage, in one look.
2. “Who's stretched thin, and who has room?”
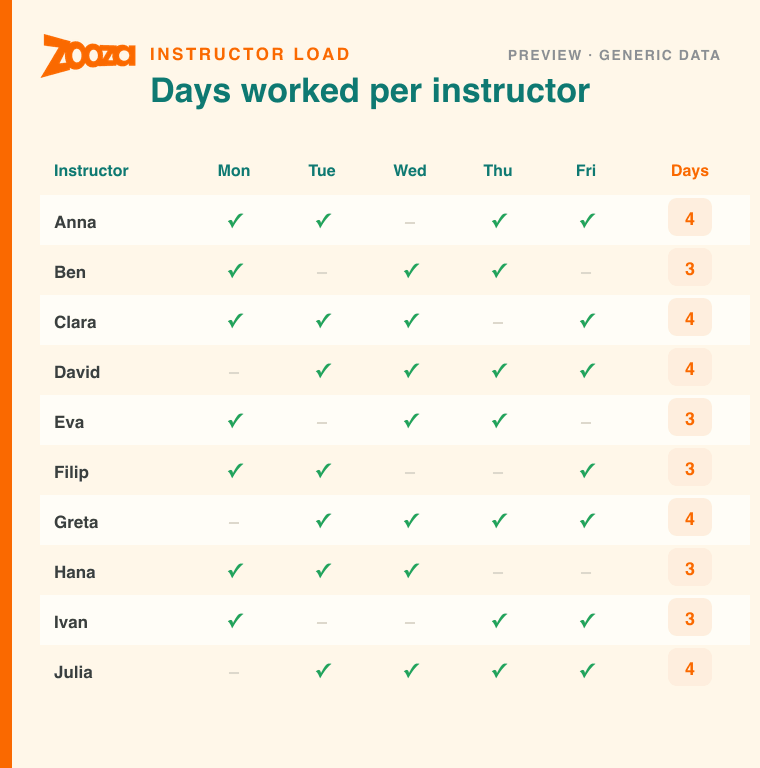
The same information, asked a different way — because a different decision needs it. Instead of venues, she wanted the count: how many days is each instructor actually working? Who's carrying five days, who's on one?
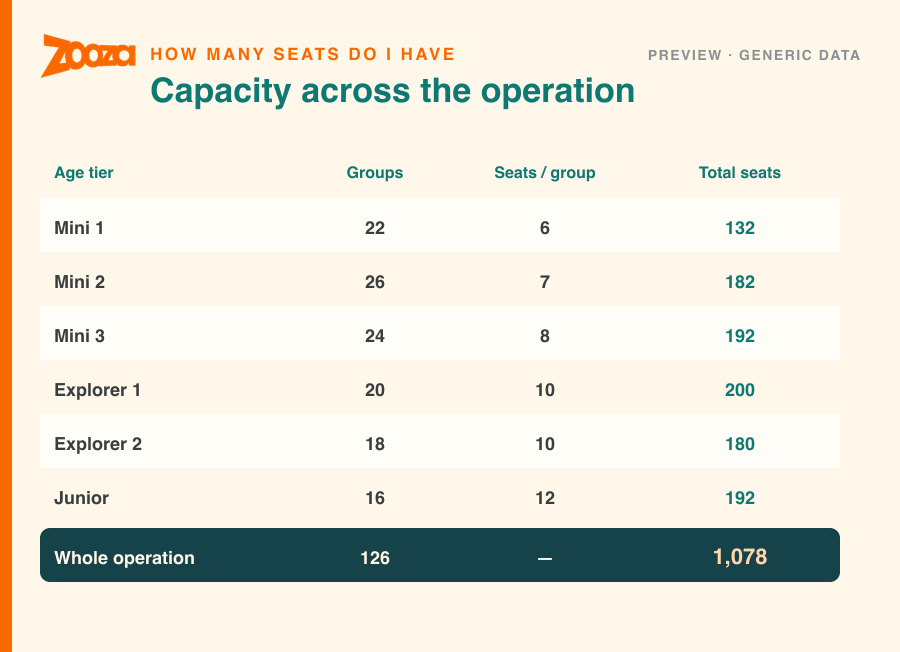
3. “How many seats do I actually have?”
Growth questions are capacity questions. She asked the AI to total it up: how many groups per age tier, how many seats each, what the whole operation holds. It came back as a single table with the number at the bottom.
4. “What grew, and what shrank, between terms?”
This is the report almost nobody builds by hand, because it's tedious — and it's the one that tells you the most. For a single location, she asked the AI to line up each course across three terms and show the start-of-term versus end-of-term numbers, side by side.
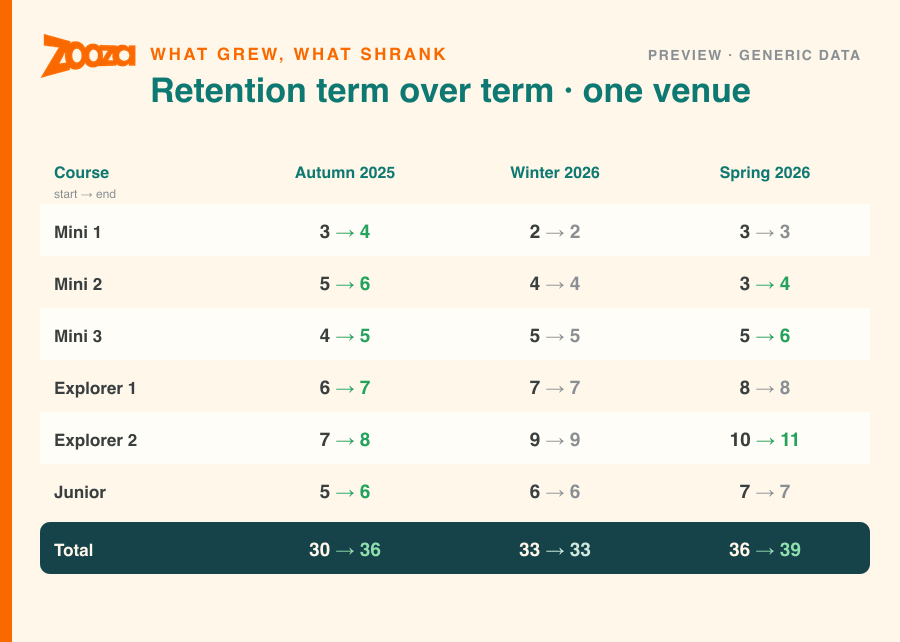
“Simple,” she said. “I didn't need a graph — I can see it right there.” And that's the honest bit: sometimes the clearest report is a chart, and you just ask for one. Often it's a plain table you can take in at a glance. You pick the shape. The report bends to how you decide, not the other way around.
And Then She Made It Keep Itself Up to Date
The part that made us smile: she didn't stop at a snapshot. She had the AI add the working formulas into her sheet — so when she changes one number, the whole thing recalculates on its own. A report that stays alive.
With Zooza Assistant connected, you get that for free from the other direction too: ask for the same view next week and it's rebuilt from your live data — nothing to re-export, nothing to refresh by hand.
Reporting Only Reads — Nothing Moves
Worth saying plainly, because it's what lets you explore freely: asking for a report never changes anything in your account. It reads your data and hands you a picture. No booking is touched, no class edited, no message sent. You can ask for twenty different views of your season and your account stays exactly as it was — the same read-only safety that lets you poke at everything without a second thought.
Why We Share This
Because no one thinks of everything. She said it herself — not everyone realises what's even possible, and we don't always know what we don't know. She found these views because she went looking with a plain question. We're sharing them so you don't have to invent them from scratch.
If any of these four is a question you've been answering the slow way — or holding in your head — it's yours to ask for too. It's the same shift we've been writing about all season: agentic AI for the start of season, from building your term to reading it back.
Try It on Your Own Numbers
You don't need anything special — just your Zooza account connected to the AI tool you already use (Claude or ChatGPT). Then ask, in plain words. Something like:
Change the question and you change the report. Capacity by age group. Retention across your last three terms. Whatever the decision in front of you needs.
Want to see what it makes of your season? Meet Zooza Assistant — or just start free and ask it your first question.